March 15, 2026
PUE in Data Centers: How to Calculate and Improve It
PUE measures data center energy efficiency. Learn the formula, benchmarks (1.08–1.63), the EU July 2026 PUE 1.2 deadline, and how modular data centers arrive pre-compliant.
Power Usage Effectiveness (PUE) is the ratio of total data center facility energy to IT equipment energy. A PUE of 1.0 is the theoretical perfect score — zero overhead. A PUE of 2.0 means half the power entering your facility never reaches a server. Lower is better. The global average sits at 1.54. Best-in-class hyperscale operators reach 1.08–1.09. Germany's new data center law mandates PUE ≤ 1.2 for new builds commissioned from July 2026.
This post covers the formula, a worked numerical example, where the industry actually sits today, what EU regulatory deadlines mean for operators, and why factory-built modular deployments arrive pre-compliant.
The PUE formula — and what it actually measures
PUE was introduced by The Green Grid in 2007 and is now codified in ISO/IEC 30134-2 and the European standard EN 50600-4-2. The formula is:
PUE = Total Facility Energy ÷ IT Equipment Energy
Total Facility Energy is everything that enters the building boundary: all IT equipment plus all cooling infrastructure (chillers, CRAH units, pumps, cooling towers), UPS conversion losses, PDU and transformer losses, lighting, building management systems, fire suppression, and physical security.
IT Equipment Energy covers only the load delivered to compute, storage, and networking. The overhead — everything that is not IT — is the gap between numerator and denominator.
A PUE of 1.0 means zero overhead, which is physically impossible. A PUE of 2.0 means half the power entering your facility never reaches a server.
Worked example: a 10 MW enterprise facility
PUE = 11,750 ÷ 8,760 = 1.34
For every 1 kWh delivered to IT equipment, 0.34 kWh goes to overhead. The inverse metric — DCiE (Data Center Infrastructure Efficiency) = 1 ÷ PUE — expresses the same thing as a percentage: 74.6% of energy reaches IT.
One important measurement nuance: PUE must always be reported alongside its measurement category. ISO/IEC 30134-2 defines three levels, ranging from UPS output (least precise) to server rack input (gold standard). A PUE of 1.15 measured at UPS output is very different from 1.15 measured at rack level. Annual averaging over 12 coincident months is required for regulatory reporting; snapshot readings taken on a cold night will always look better than summer peaks.
Where the industry actually sits: from 1.08 to 1.63
The gap between hyperscale operators and the broader enterprise market is not subtle.
Google's global fleet averaged PUE 1.09 in 2024, with individual sites reaching 1.04. Meta reported a fleet average of 1.08, with its Prineville facility approaching 1.06. AWS averaged 1.15 across its owned portfolio, with European sites at 1.04. Microsoft reported 1.16 for FY2024.
The broader market tells a different story. The Uptime Institute's 2025 Global Data Center Survey — 681 respondents, the industry's longest-running benchmark — put the weighted global average at 1.54. That figure has been essentially flat since 2018. The average enterprise on-premises facility runs at approximately 1.63 (IDC, January 2025). Major colocation operators range from 1.39 to 1.58.
The stagnation has a structural explanation. Legacy facilities built 10–15 years ago, with constant-speed cooling units, no aisle containment, and UPS systems running at 40–50% of rated capacity, cannot easily match what purpose-built modern facilities achieve. Cooling alone accounts for 30–40% of total data center energy consumption. UPS conversion losses add another 3–8%. These two categories represent the majority of PUE overhead — and the highest-leverage targets for improvement.
The EU regulatory picture: reporting now, binding thresholds coming
The EU Energy Efficiency Directive (2023/1791) — the EED — established the first EU-wide data center reporting regime. Facilities with installed IT power of at least 500 kW must report PUE, water usage, renewable energy share, and several other indicators annually to a European Commission database. First reports were due September 2024; subsequent filings are due 15 May each year.
The EED itself does not set binding PUE thresholds — it is a transparency framework. The European Commission's Delegated Regulation (EU) 2024/1364, published May 2024, operationalizes reporting requirements, defining 24 KPIs and four sustainability indicators including PUE.
The binding PUE cap most operators are tracking is German national law, not an EU mandate — a distinction many sources conflate. Germany's Energieeffizienzgesetz (EnEfG), in force since November 2023, requires:
- New builds commissioned from 1 July 2026: PUE ≤ 1.2 within two years of commissioning
- Existing facilities: PUE ≤ 1.5 from July 2027, tightening to PUE ≤ 1.3 by July 2030
The law applies to public data centers with non-redundant connected load of 300 kW or more and private facilities of 1,000 kW or more. Penalties for non-compliance reach €100,000.
Germany is the leading indicator, not the exception. The European Commission is preparing a Data Centre Energy Efficiency Package targeting April 2026, which includes work on EU-wide minimum performance standards. What is German law today is likely EU-wide policy within a few years. Operators building or procuring data center capacity in Europe are building against regulations that will tighten further.
For a full breakdown of EED scope, KPIs, and member-state transposition timelines, see our EU Data Center Regulations guide.
Four things that move PUE the most
Cooling architecture is the primary lever. Hot/cold aisle containment alone reduces cooling energy by 15–35%. Raising supply air temperature setpoints from the legacy 18°C to ASHRAE-recommended 27°C saves 4–5% in cooling energy per degree. Free cooling — using outdoor air or water-side economizers — can cut cooling energy by up to 86% in cool climates. For high-density AI inference workloads at 40 kW per rack and above, direct-to-chip liquid cooling delivers 40–60% cooling energy reductions versus air cooling and consistently produces PUE below 1.2. For a detailed look at cooling options and their PUE impact, see our data center cooling technologies overview.
UPS loading and efficiency compounds throughout the power chain. Modern UPS systems in eco-mode achieve 98–99% efficiency versus 94–97% for legacy double-conversion at partial load. At 5 MW of IT load, a 3% efficiency gap represents roughly 1,500 MWh of wasted energy per year.
Stranded capacity inflates overhead without adding useful compute. The Uptime Institute's 2024 survey found one in four data centers operating below 40% IT capacity utilization. Facilities built for eventual full load but running at half capacity pay the PUE penalty the entire time.
Right-sizing at build time is where the modular argument becomes financially concrete. Traditional builds spec infrastructure for a peak load years in the future, operate at partial load, and run cooling and power distribution at near-constant overhead throughout. Every megawatt of stranded cooling capacity running at idle is overhead with no corresponding IT load to offset it.
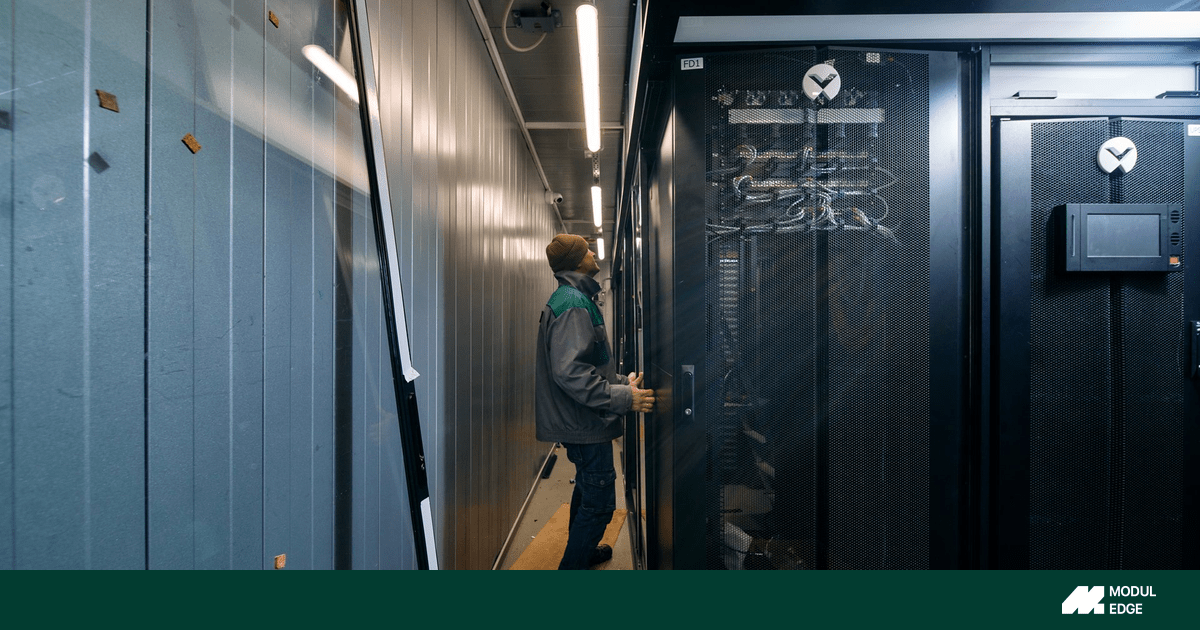
Why factory-built modular hits 1.2 at commissioning
Factory-built modular data centers (MDCs) consistently achieve PUE of 1.1–1.3, with best-in-class deployments reaching 1.08–1.15. Three structural reasons explain why they start at low PUE — rather than working toward it over years of post-commissioning optimization.
Capacity is matched to actual load from day one. A modular build deploys only the cooling and power infrastructure needed for the current phase. When load grows, a new module is added. There is no stranded CRAC capacity, no oversized UPS running at 30% load. Overhead and IT load stay proportional throughout the growth curve. This is the primary reason modular deployments structurally achieve lower PUE than traditional builds across their operating life, not just at rated capacity.
Free cooling and integrated cooling packages come pre-engineered. Indirect evaporative cooling modules, adiabatic cooling skids, and DX/chilled water options are selected and integrated in the factory against the specific site climate and workload specification. There is no post-commissioning cooling optimization project. Airflow paths are designed, tested, and validated at factory acceptance testing before the module ships.
Power conversion losses are minimized at the design stage. High-efficiency UPS systems, optimized cable runs, and right-sized distribution architecture are specified against actual IT load rather than over-engineered for theoretical peak. The power chain runs near its efficiency sweet spot from the first day of operation.
For operators building in Germany or specifying EU infrastructure, modular designs achieving 1.1–1.2 PUE arrive pre-compliant with the July 2026 EnEfG threshold — avoiding the expensive retrofit cycle traditional builds may face. For edge deployments in harsh environments — oil and gas sites, mining operations, industrial automation — integrated free cooling and environmental hardening (dust, humidity, vibration tolerance) address the site constraints that typically push edge PUE above 1.5.
What to do with this number
PUE is a ratio, not a verdict. A PUE of 1.5 at 30% IT utilization tells you something very different from 1.5 at 90% utilization. The number needs context: measurement category, averaging period, IT load factor, and climate.
What it reliably signals is where overhead is going. If your PUE is above 1.4, the gap between that and 1.2 represents real electricity cost, real carbon, and increasingly real regulatory exposure. If you are specifying new infrastructure for an EU market, the design should start from a 1.2 target — not treat it as a future optimization exercise.
A design review at the module level — cooling architecture, power chain, IT density, and site climate — is the fastest way to understand where your PUE lands and what it costs to close the gap.
Frequently asked questions
What is a good PUE for a data center? A PUE below 1.2 is considered excellent and is the threshold mandated by Germany's EnEfG for new data centers commissioned from July 2026. A PUE between 1.2 and 1.4 is good. The global average is 1.54 (Uptime Institute, 2025). Anything above 1.6 indicates significant room for improvement in cooling and power infrastructure.
What is the difference between PUE 1.0 and PUE 2.0? A PUE of 1.0 is the theoretical ideal — 100% of facility power reaches IT equipment, with zero overhead. It is physically unachievable. A PUE of 2.0 means 50% of facility power is consumed by cooling, power conversion, and building systems, with only 50% reaching IT. The practical minimum in real deployments is approximately 1.02–1.04.
How is PUE calculated? PUE = Total Facility Energy ÷ IT Equipment Energy. Both values should be measured in kWh over the same 12-month period. Total Facility Energy includes all cooling, UPS, PDU, lighting, and building loads. IT Equipment Energy covers servers, storage, and networking only. ISO/IEC 30134-2 defines three measurement categories depending on where IT energy is metered.
Does the EU require a specific PUE? The EU Energy Efficiency Directive (2023/1791) requires data centers with 500 kW or more of installed IT power to report their PUE annually, but does not set a binding PUE target. Germany has gone further with its Energieeffizienzgesetz (EnEfG), which mandates PUE ≤ 1.2 for new builds from July 2026. EU-wide minimum performance standards are under development and expected to follow Germany's lead.
Why do modular data centers have better PUE? Modular data centers achieve lower PUE at commissioning because they deploy only the cooling and power infrastructure needed for actual current load — eliminating stranded capacity. Free cooling options are integrated at the factory, and UPS and distribution systems are sized to actual IT load rather than speculative future peak. The facility operates near its efficiency design point from day one, rather than spending years at partial load with full overhead running.
What causes high PUE in a data center? The main causes are: inefficient cooling (oversized or constant-speed CRAC units, no aisle containment, overcooling), UPS systems running at low utilization, poor airflow management that mixes hot and cold air, and stranded capacity — cooling and power infrastructure running at near-constant load while IT utilization is low.
